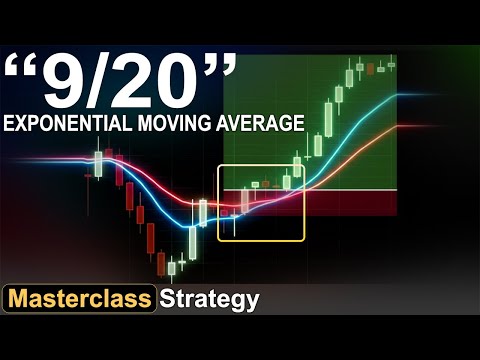
EMA Ribbon Squeezes, Fan Expansion & Golden Crosses
How to detect explosive breakouts before they happen using EMA compression pinching, how to ride the 8-line ribbon trend fan, and how to filter out fake Golden Crosses.
Market volatility is cyclical: periods of high volatility are always followed by low volatility, and vice versa. When the fast (9/15/20) and slow (50/200) EMAs converge into a single horizontal braid, explosive directional momentum is imminent.
• The Golden Rule: Never take scalps while the ribbon is pinched—the risk of chop is highest.
• The Break Trigger: Wait for a full candle body close outside the pinch band with 2x average volume.
Once expansion begins, the EMAs fan apart like the spokes of a bicycle wheel. As long as the ribbon lines remain strictly parallel without crossing each other, the trend is robust and institutional accumulation is ongoing.
• Bullish Fan: Fast EMAs layered on top (9 > 15 > 50 > 200).
• Bearish Fan: Fast EMAs layered on bottom (9 < 15 < 20 < 50 < 200).
A classic Golden Cross occurs when the 50 EMA crosses above the 200 EMA. In strong macro bull markets, this heralds a multi-month trend. However, in sideways markets, crosses lag and generate whipsaws.
• Valid Cross: The 200 EMA must be flattening or sloping upward, NOT sloping downward.
• Entry Rule: Never buy the exact cross candle. Buy the subsequent retest of the 50/200 EMA zone.
Eliminate guesswork from trade exits. Rather than taking profits prematurely, trail your stop loss behind the 20 EMA until a full candle closes on the opposite side of the 20 EMA.
• Aggressive Trail: Close trade on 1st candle close below 9 EMA.
• Swing Trail: Hold trade until a 2-bar close occurs below the 20 EMA.
The Ribbon Scalp Strategy in 3 Steps
Check the 4H chart. Confirm that the 9/20/50 EMAs are fanned out and sloping at one clean direction.
Wait for price to pull back into the 15/20 EMA zone on the 5M chart. Look for a wick rejection leaving a long lower shadow.
Place your stop loss behind the 34 EMA. Target 2x your risk at the prior swing high.
Recommended Videos
Watch these to deepen your understanding of EMAs in real market conditions.