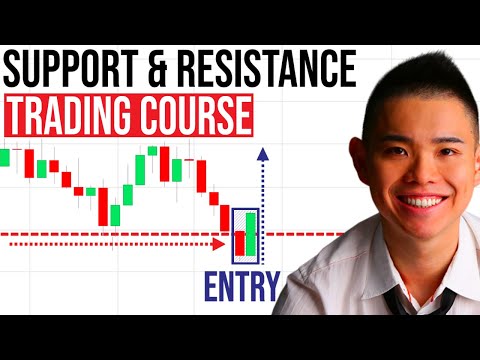
Horizontal S/R & Polarity Zones
How institutional order flow builds horizontal price floors and ceilings, how to construct reliable dynamic trendlines, and how to tell genuine structural breakouts from low-liquidity fakeouts.
Amateur traders draw razor-thin horizontal lines and get stopped out on minor 10-cent wicks. Institutions accumulate orders across price bands (e.g., $160.00 - $161.50). Treat key levels as memory zones where liquidity clusters.
• Support Zone: Concentrated buyer limit orders that exceed active market sell orders.
• Resistance Zone: Concentrated institutional resting offers that cap upward price expansion.
Once a major resistance level is cleanly breached with high volume, trapped short sellers seek to cover at breakeven while breakout buyers add to positions. Old resistance becomes future baseline support.
• Never chase the initial breakout candle green-to-the-moon.
• Wait for the low-volume pullback (retest) back to the broken level to confirm buyers defend the new floor.
A valid trendline requires at least 3 distinct touchpoints. Two points create a tentative angle; the third confirms the market recognizes the slope.
• Touch 1 & 2: Establishes the trajectory.
• Touch 3: The primary execution trigger for swing & pullback entries.
• Touch 4+: High risk of exhaustion and trendline decay.
Smart money frequently pushes price a bit beyond a visible resistance line solely to trigger retail buy-stops and liquidate early shorts before slamming price back into the range.
• Volume Expansion: Breakout candle has 2x+ relative volume.
• Time Close: Higher timeframe candle (1H or 4H) closes cleanly outside the zone.
Trade Execution Checklist
Show how price reacts in that zone first, don't enter directly, wait for candle close and price respects basic price action rule.
A trendline touch alone is not an automatic buy signal. Combine the trendline touch with recent last 10/15 days trends, or 50 EMA for confluence setup.
You can spot this zone using Volume Profile rules for extra confirmation.
- 1. Over-drawing lines: If your chart looks like spaghetti with 20 horizontal rays, you have zero conviction. Keep only the 2-3 most obvious HTF levels.
- 2. Front-running the break: Buying before resistance is broken because you "feel" it will break is gambling. Wait for candle confirmation.
- 3. Ignoring macro trend context: Buying support during an aggressive macro downtrend produces lower-probability bounces than buying support in an uptrend.
Recommended Videos
Watch these to deepen your understanding of Support, Resistance & Trendline in real market conditions.